Important Note : Microsoft R-Open (MRO) will be phased out and ML Server has retired.
See here for details.
Scale R workloads for machine learning (series)
- Statistical Machine Learning Workloads <– This post is here.
- Deep Learning Workloads (Scoring phase)
- Deep Learning Workloads (Training phase)
In this post, I’ll describe the benefits of Microsoft R technologies, such as Microsoft R Open (MRO) and Microsoft Machine Learning Server, for AI engineers and data scientists with a few lines of code.
Microsoft R Open – Designed for MultiThreading
R is popular programming language for statistics and machine learning, but it has some concerns for enterprise use. The biggest one is the lack of parallelism.
Microsoft R Open (MRO) is renamed from the famous Revolution R Open (RRO). MRO is fully compatible with standard R (such as CRAN).
By using MRO, you can take advantage of multithreading and high performance.
Please see the following official document about the benchmark.
The Benefits of Multithreaded Performance with Microsoft R Open
https://mran.microsoft.com/documents/rro/multithread/
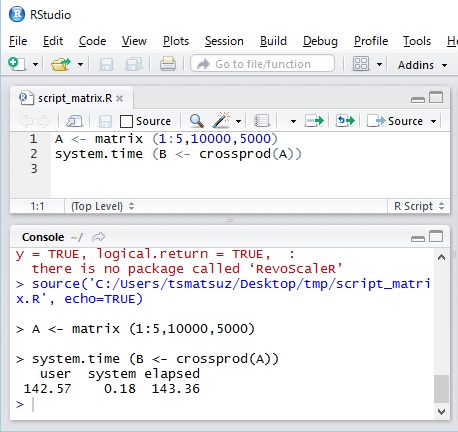
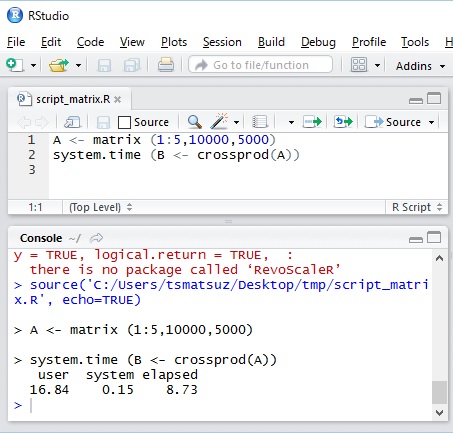
This document says that the matrix manipulation is especially faster than open source R. Now let’s see the following simple example to see this. Here I’ve compared with CRAN R version 3.3.2 and MRO version 3.3.2 on Lenovo X1 Carbon (with Intel Core vPro i7).
The variable “A” includes 10000 x 5000 matrix, which elements are the repeated values of 1, 2, 3, 4, 5, 1, 2, 3, 4, 5, 1, 2, … Then we generate the cross-product matrix by A and measure this operation using system.time().
A <- matrix (1:5,10000,5000)
system.time (B <- crossprod(A))
The result are the following output.
As you can see below, MRO is over 8 times faster than CRAN R.
R 3.3.2 [64 bit] (CRAN)
Microsoft R 3.3.2 [64 bit] (MRO)
Running analysis functions for the large amount of data is also faster in MRO.
Note : If you’re using RStudio and installing both CRAN and MRO, you can change the R runtime in RStudio using [Tools] – [Global Options] menu.
Note : Microsoft R Open is now default R runtime in Anaconda distribution. (See “anaconda.com blog – Introducing Microsoft R Open as Default R for Anaconda Distribution“.)
Microsoft Machine Learning Server – Distributed and Scaling in R
With the help of Microsoft Machine Learning Server (ML Server) (or Microsoft Machine Learning Services, formerly, Revolution R Enterprise -> R Server), you can distribute and scale R workloads across multiple machines (i.e, a cluster). ML Server also provides data chunking (streaming) from disks and it can operate massive volume of data by sequential manners. (Without ML Server, data should fit in memory and the size of data will be limited.)
The Machine Learning Server (ML Server) can be run on Windows (including SQL Server process), Linux, Teradata, or Hadoop (Spark) clusters.
In this post, we will see ML Server on Apache Spark (using Azure HDInsight 3.6)., with which you can distribute R algorithms on Apache Spark cluster.

Note : Formerly ML Services on Spark was called R Server, however it’s renamed as “Machine Learning Services (ML Services)” on Sep 2017 and it also includes Python support as well as R.
Note : For Windows, the license of ML Server is included in SQL Server. (See here.) You can easily run the standalone ML Server (with SQL Server 2016 Developer edition) by using Data Science Virtual Machine (DSVM) in Microsoft Azure.
Note : Spark ML (formerly, Spark MLlib) is also the machine learning component widely used on Spark community, but currently almost functions are not supported in R. (The mainly supported languages are Python, Java, and Scala.)
You can also use SparkR or sparklyr, but SparkR is currently just the data transformation for R computing (not mature for various machine learning tasks).
Here I’ll skip how to setup your ML Server (R Server) on Apache Spark (see here for installation), but the easiest way is to use Azure-managed Hadoop cluster, called Azure HDInsight. (See the following important note.)
You can soon setup your own experiment environment by just a few clicks as follows. (You can also manually install ML Server on Apache Spark without HDInsight.)
- Create ML Services (R Server) workload on Azure HDInsight. You just input several terms along with HDInsight cluster creation wizard on Azure Portal, and all the computer nodes (head nodes, edge nodes, worker nodes, and zookeeper nodes) are automatically setup.

- If needed, setup RStudio connected to the edge node on Spark. (See above picture.)
Then RStudio Server Community Edition on edge node is automatically installed.
Note : ML Services on Azure HDInsight is only supported on HDInsight 3.6 and this version of HDInsight will retire on 31 Dec 2020. (HDInsight 4.0 will not include ML Services.)
You should manually install ML Server after Jan 2021. (see here for installation).
The following illustrates the topology of Spark clusters.
The workloads of ML Server reside in both edge node and worker nodes.
The edge node is for the development front-end, and you can interact with ML Server workers through this node. RStudio Server is also installed on this edge node. When you run your R scripts on RStudio, this node starts (kicks off) all computing workloads distributed to worker nodes.
If the computation cannot be distributed for some reason (both intentionally and accidentally), these workloads will run on local edge node.

Now you can use RStudio on web browser by connecting to edge node with SSH tunnel. (See the following screenshot.)
It’s very convenient way for running and debugging your R scripts on ML Server.
Now I prepared the dataset (a part of Japanese stocks daily reports) over 35,000,000 records (1 GB). You can download the dataset from here.
When I run my R script with this huge data on my client PC, the script will fail because of timeout or the failure of memory allocation. However, you can run the same workloads on ML Server in Spark cluster.
Now here’s (below is) the R script which I run on ML Server. (Please copy the following code in your RStudio on web browser.)
##### The format of source data
##### (company-code, year, month, day, week, open-price, difference)
#
#3076,2017,1,30,Monday,2189,25
#3076,2017,1,27,Friday,2189,-1
#3076,2017,1,26,Thursday,2215,-29
#...
#...
#####

# Set Spark clusters context
spark <- RxSpark(
  consoleOutput = TRUE,
  extraSparkConfig = "--conf spark.speculation=true",
  nameNode = "adl://jpstockdata.azuredatalakestore.net",
  port = 0,
  idleTimeout = 90000
)
rxSetComputeContext(spark);

# Import data
fs <- RxHdfsFileSystem(
  hostName = "adl://jpstockdata.azuredatalakestore.net",
  port = 0)
colInfo <- list(
  list(index = 1, newName="Code", type="character"),
  list(index = 2, newName="Year", type="integer"),
  list(index = 3, newName="Month", type="integer"),
  list(index = 4, newName="Day", type="integer"),
  list(index = 5, newName="DayOfWeek", type="factor",
       levels=c("Monday", "Tuesday", "Wednesday", "Thursday", "Friday")),
  list(index = 6, newName="Open", type="integer"),
  list(index = 7, newName="Diff", type="integer")
)
orgData <- RxTextData(
  fileSystem = fs,
  file = "/history/testCsv.txt",
  colInfo = colInfo,
  delimiter = ",",
  firstRowIsColNames = FALSE
)

# execute : rxLinMod (lm)
system.time(lmData <- rxDataStep(
  inData = orgData,
  transforms = list(DiffRate = (Diff / Open) * 100),
  maxRowsByCols = 300000000))
system.time(lmObj <- rxLinMod(
  DiffRate ~ DayOfWeek,
  data = lmData,
  cube = TRUE))

# If needed, predict (rxPredict) using trained model or save it.
# Here's just ploting the means of DiffRate for each DayOfWeek.
lmResult <- rxResultsDF(lmObj)
rxLinePlot(DiffRate ~ DayOfWeek, data = lmResult)

# execute : rxCrossTabs (xtabs)
system.time(ctData <- rxDataStep(
  inData = orgData,
  transforms = list(Close = Open + Diff),
  maxRowsByCols = 300000000))
system.time(ctObj <- rxCrossTabs(
  formula = Close ~ F(Year):F(Month),
  data = ctData,
  means = TRUE
))
print(ctObj)
Now you can see that I’m using a lot of “rx…” functions, instead of standard R functions. These are all in RevoScaleR (ScaleR) package.
If you are familiar with Apache Spark, you know that it will be scaled on multiple machines (cluster) when it’s just written by pyspark or sparklyr. Same like this, these operations are all scaled and distributed when you just use RevoScaleR functions.
When you set the context with rxSetComputeContext, the data will not be transferred in your program, but the R script is transferred to each server and then executed. (You can use rxImport, when you want to explicitly download the data into your program, in which the script is running.)

Note : Before running this script, I’ve uploaded the source data (testCsv.txt) on Azure blob, which is the same storage as the primary storage in Hadoop cluster. The code “
adl://...” in my program indicates URI of this blob (Azure Data Lake storage).
RxTextData() is corresponding to standard read.table() or read.csv(). rxLinMod() is corresponding to lm() (linear regression), and rxCrossTabs() is xtabs() (cross-tabulation).
You can use these R functions for leveraging the computing power of Hadoop clusters.
Here I don’t describe all these scaling functions, but see the following official document for details.
Microsoft R – RevoScaleR Functions for Hadoop
https://msdn.microsoft.com/en-us/microsoft-r/scaler/scaler-hadoop-functions
Microsoft R – Comparison of Base R and ScaleR Functions
https://msdn.microsoft.com/en-us/microsoft-r/scaler/compare-base-r-scaler-functions
Note : You can also use revoscalepy package for Python.
Note : To see the help document for each RevoScaleR functions, please type “
?{function name}” (e.g, “?rxLinePlot“) in R console.Note : You can also use more fast modeling functions implemented by Microsoft Research called MicrosoftML . (The package is used with the RevoScaleR package.)
This package includes the functionality for anomaly detection and deep neural networks.
While the script is running, please see YARN resource manager (rm) UI in Hadoop.
You could find the running applications of RevoScaleR (ScaleR) on the scheduler. (See the following screenshot.)
When you monitor the worker nodes in resource manager UI, you could find that all nodes are used for computation.
The RevoScaleR functions are also included in Microsoft R Client (on top of Microsoft R Open), which can run on the standalone computer. (You don’t need extra servers.) Then you can debug the script with RevoScaleR functions on standalone desktop in your initial development time.
Using Microsoft R Client, you can also send the completed R scripts to the remote ML Server for execution. (Use mrsdeploy package.)
You can take a lot of advantages of the robust computing with Microsoft R technologies !
[Change history]
2018/06/29 Name change for Azure HDInsight R Server : “R Server” -> “ML Services (R Server)”
Categories: Uncategorized


comment
LikeLike